White Paper
Risk Adjustment Methodology of Prometheus Analytics
Summary
Explore how providing different risk adjustment models for each episode of care captures the episode-specific contribution of risk factors to resource use.
Whitepaper |ĚýArchana Shah
Product Manager Prometheus Analytics at µçłµÎŢÂë
Archana has 20+ years of experience in the information technology ans services industry.
Introduction
Prometheus Analytics is perhaps the most comprehensive system available for analyzing provider performance and developing and implementing value-based payment models around episodes of care. A critical feature of any episode grouper is the application of appropriate methods of risk adjustment to accurately and fairly account for individuals’ insurance risk in relation to episode costs.
The purpose of this paper is to describe the methodology used to risk-adjust episode costs in Prometheus Analytics. It begins with a description of the development history of the method, as well as the key principles that guided its development. The next section lays out the methodology itself, describing the key clinical variables used to model covariates and the modeling procedures that produce expected episode costs. The final section concludes with a discussion of several relevant issues and considerations with respect to the method described.
Development of the Prometheus Analytics Risk Adjustment Methodology
Prometheus Analytics uses a risk adjustment methodology developed through a collaboration between the Health Care Incentives Improvement Institute (HCI3) and researchers from the Schneider Institutes for Health Policy at Brandeis University. The intent was to develop an episode grouper for the Centers for Medicare and Medicaid Services (CMS). The framework developed for that project greatly informed the approach described below.
Fundamental Principles of the Prometheus Analytics Risk Adjustment
The risk adjustment process within Prometheus Analytics is based upon several guiding principles:
1) Models should be applicable for multiple uses
The Prometheus Analytics risk adjustment model is designed to give users flexibility in performing risk adjustment for two use cases:
- To create fair and accurate comparisons of provider performance by appropriately adjusting for differences in patient severity
- To develop patient-specific budgets for bundled payment arrangements based on an individual’s insurance risk, such as demographics and comorbidities
2) Models should be tailored to the specific patterns of resource use within each individual episode or condition
Because the resources used for a procedure such as cataract surgery are very different from those used with patients with who have asthma or have had a stroke, Prometheus Analytics creates different risk adjustment models for each episode of care. This way, each model captures the episode-specific contribution of individual risk factors (e.g., age, gender, comorbidities, episode severity) to resource use.
3) Models should distinguish between typical care and potentially avoidable complications
For each episode of care, the model separately risk-adjusts the costs for typical care as well as the costs for potentially avoidable complications (PACs). Segmenting costs in this manner provides several important advantages. It gives users a way to compare physicians and hospitals along two dimensions of episode costs, adjusted for differences in provider case mix. These comparisons can reveal deeper insights about the efficiency and quality of care above and beyond simple comparisons of risk-adjusted episode costs. For bundled payments, the models allow users to construct budgets that create different yet complementary incentives for individual providers: one that fully rewards providers for providing appropriate typical care, and another that puts significant downward pressure on the occurrence of PACs.
4) Incentivize efficiency and appropriate care
Prometheus Analytics risk adjustment avoids creating unwanted incentives in two principle ways. First, the models adjust for only warranted sources of cost variation, or variation that is typical and expected based on the clinical comorbidities of the patient or the complexity of services performed. Sources of unwarranted variation (specifically, complications and measures of utilization) are expressly avoided as risk-adjusters.
Adjusting for complications in the models would remove the incentive to reduce their occurrence. Similarly, adjusting for utilization allows providers whose patients frequently use high-intensity services, such as inpatient stays, to appear as better performers or receive higher payments relative to providers whose patients use fewer highcost services.
The second way the models create appropriate incentives is by relying on prospective risk adjustment to model costs. This means that the models predict future episode costs using the combination of an individual’s comorbidities and episode severity markers that are known—up to and including the point the episode begins. Prospective risk adjustment ensures that the predicted costs for an individual reflect what would be expected given their clinical history.
This type of modeling approach is different from concurrent or retrospective risk adjustment models, which use diagnoses and events occurring during the episode itself to account for variations in episode costs. Such models are undesirable because they have the potential to promote gaming and introduce incentives that are antithetical to efficiency and quality.
5) Models should be specifically tailored to the user’s own data
A wealth of research shows that large differences exist across geographies, payers, and populations in terms of underlying case mix, fee schedules, coding practices, and provider practice patterns.
These differences, in turn, contribute to variations in resource use. As a result, not only do costs differ widely for any given episode across populations, but also the models that estimate the unique relationships between risk factors (e.g., comorbidities, etc.) present differently in a specific population and its resource use.
To ensure that a user’s risk adjustment models capture the unique contributions of individual risk factors to episode costs within its own population, Prometheus Analytics requires that personalized models be created each time a new data set is run. Although this may prohibit risk adjustment in some cases, when sample sizes are limited, it obviates the potential for problems that can arise when applying models developed on “large representative populations” to smaller sub-groups of individuals.
Description of Prometheus Analytics Risk Adjustment Methodology
The Prometheus Analytics risk adjustment models predict individualized episode costs using information on individuals’ characteristics, comorbidities, and severity. The estimates are the result of a series of regression models that are combined to produce expected episode costs. These costs are decomposed into those for typical care and PACs. Each aspect of the modeling procedure is described in detail below.
Selection of Episodes for Models
By default, episodes are excluded from the models if an individual is less than 18 and greater than 64 years of age, or if the episode is not complete, such as when the window extends beyond the time period observed in the claims. To avoid the potential for including false positive episodes or those with unusually high costs, episodes in the top and bottom percentiles of the cost distribution are also excluded. Within Prometheus Analytics, users have the option of adjusting the exclusion criteria for their own needs.
Description of Costs
While the episode of care serves as the main unit of inference in analyzing costs, for the purposes of modeling, episode costs are split into those related to typical care and those for PACs. These are determined from the claim’s assignment process within Prometheus Analytics.
For procedural and acute episodes, typical costs are further split into those for the index inpatient stay for the event or procedure and all remaining costs (e.g., professional, outpatient facility, radiology, laboratory, ancillary services, and pharmacy). All costs for chronic conditions are annualized.
The costs of each component serve as the dependent variables in the models. Separate risk adjustment models are created for each cost component and for every episode type.
Description of Covariates
The risk adjustment models include a number of patient-level covariates. As described earlier, the modeling process is careful to account only for sources of warranted variation that exist up to the point the episode triggers—namely, the individual’s insurance risk markers. The covariates used in the models include:
- Patient Demographics and Enrollment: This includes the individual’s age in years and a dichotomous indicator for gender (1=Female, 0=Male). Also included is an indicator (1=Yes, 0=No) indicating if the individual was enrolled in a plan within the previous six months. The purpose of this variable is to account for a patient’s lack of claims history, which limits the number of potential comorbidities that can be identified for the individual.
- Risk Factors:These include a list of pre-existing comorbidities that an individual has or had prior to the start date of the episode. These are identified from the diagnosis codes that are found in the individual’s claims history and are universally applied to every episode type. By default, any risk factor identified over the course of a person’s claims history, regardless of the time it occurred in relation to the episode, can be potentially included in the models. However, users have the option of specifying shorter periods (e.g., 12 months, 18 months, etc.) from which to draw relevant risk factors for the models.
- Episode Subtypes:These are episode-specific markers that distinguish one episode as being more severe than another. They can indicate either specific patient comorbidities that are known to make a condition or procedure more difficult to treat (e.g., obesity), the severity of the illness itself, or the complexity of the procedure. Subtypes are identified from claims that occurred from the start of the episode up to and including when the episode triggered. While their inclusion verges on creating a potential for gaming, the subtypes do provide a way to account for important “within episode” differences in severity in the models that are not captured by pre-existing comorbidities. Moreover, it is far more appropriate to include subtypes occurring at the beginning of the episode than those that would occur later, which should more appropriately be classified as sequelae of the episode rather than a reclassification to a different severity level.
- End-of-Life Probability:Individuals nearing the end of their lives have very different cost trajectories than others, making end of life a potentially important predictor of episode costs. Simply adjusting for whether an individual died during the episode in the models would create the potential for adverse incentives, as would excluding these episodes from the models altogether.
Consistent with the idea of adjusting only for individuals’ clinical risk at the beginning of the episode, the models make use of a measure to adjust for potential end of life during the episode. To do this, a logistic regression model is fit to predict a person’s probability of death at the beginning of the episode based on their demographics and historical risk factors. These probabilities are then inserted as covariates in the main cost models described in the next section.
Importantly, because the likelihood of death in the commercially insured population is low and claims data frequently lack information on the date of death, this variable is optional in the risk adjustment.
Once all relevant risk factors and subtypes have been identified for an episode, two additional steps are completed prior to their inclusion in the models. First, to minimize the potential for unstable coefficients, any risk factors or subtypes included in fewer than 10 episodes are discarded for modeling. Second, any overlapping risk factors and subtypes for an episode are collapsed into a single variable.
Modeling Expected Episode Costs
As mentioned, separate risk adjustment models are developed to estimate each of the different cost components (e.g., typical costs, PAC costs) in an episode. The modeling process uses a two-part multivariate regression process to estimate episode costs.
In the first step, a logistic regression model is fit to estimate the probability of having non-zero costs for the cost component.
Next, ordinary least squares regression (OLS) models are then fit to estimate predicted costs using the subset of episodes with non-zero costs. Fully expected cost is derived by multiplying the probability of non-zero cost episodes and predicted cost for each episode. Stated differently, the expected costs from these models are the individual’s predicted costs conditional on their probability of having any costs for the cost component.
The purpose of the two-stage models is to avoid the problems that arise in OLS when a sizeable proportion of observations have the same outcome variable––in this case, $0 for the episode-cost component. This causes a violation of the normality assumption underlying OLS and may lead to biased results.
Note that for some episodes and certain cost components, the two-stage model process is not always needed. For example, most procedure and acute episodes will always have an index stay and other typical costs. However, not all of these episodes may have PAC costs. On the other hand, a chronic condition may have neither typical nor PAC costs if an individual incurs no claims during an observation year. For situations in which more than 90% of episodes have non-zero costs for a specific component, only OLS models are estimated. Otherwise, the two-stage method is applied.
A critical feature of any episode grouper is the application of appropriate methods of risk adjustment to accurately and fairly account for individuals’ insurance risk in relation to episode costs.
Because the purpose of the risk adjustment is to obtain well-developed expected episode costs rather than explain the individual contributions of particular covariates, all risk factors and subtypes meeting the minimum cutoff mentioned previously are included in each of the models. No additional actions are taken to select a more parsimonious set of predictors in the models.
This choice reflects a desire to explain as much variation in costs as possible, but it does not make it a priority that all covariates in the models be individually significant or even uncorrelated with each other. This allows for fewer potentially artificial constraints around the definitions of severity of an episode condition, and lets each regression model determine for itself which of the factors are more significant for a specific episode. Non-significant covariates in the episode’s cost models should not influence the predicted outcomes. It is better to have a group of similarly related covariates work together to explain the variation rather than it being explained by a single factor.
Once all cost components in an episode have been estimated, they are combined to get a total expected cost for the complete episode.
Additional Issues and Considerations
There are several issues for users to consider when applying the risk adjustment models, as they can affect the quality of the analysis and conclusions made from the data. A few of the more important concepts are discussed here.
Model and Covariate Selection
Considerable attention has been paid to the selection of optimal regression models (e.g., twopart models versus generalized linear models, etc.) as well as selecting the most parsimonious and meaningful set of model covariates (e.g., stepwise regression, regularized regression techniques, etc.). Such regression models are used to improve cost estimates or minimize the potential for over-fitting. There is no consensus on any of these issues, and each available method has advantages and disadvantages.
The Prometheus risk adjustment process has sought to strike a balance between statistical rigor and methods that can be implemented and interpreted by a wide range of users. Although more sophisticated modeling could provide advantages, such models have their own challenges and trade-offs, such as increased complexity and less transparency. Notably, when tested against other modeling approaches in large data sets, the two-part models described above have been found to have negligible differences in predictive power or the potential for over-fitting. Nevertheless, the technical processes underlying risk adjustment in Prometheus Analytics can be easily adapted if users are interested in testing and implementing other modeling procedures.
Sample Size
As with all statistical modeling, larger sample sizes produce better estimates of episode costs. Because certain types of episodes occur less frequently than others, especially when data sets are small, it is important for users to consider the number of episodes when applying the risk adjustment models.
Low sample sizes can produce models that lack precision in estimating episode costs or lead to over-fitting. The issue of poor precision is illustrated in the figure below. It depicts the average prediction error (ratio of average actual costs to average predicted costs) of the risk adjustment model across different sample sizes for knee replacement episodes.
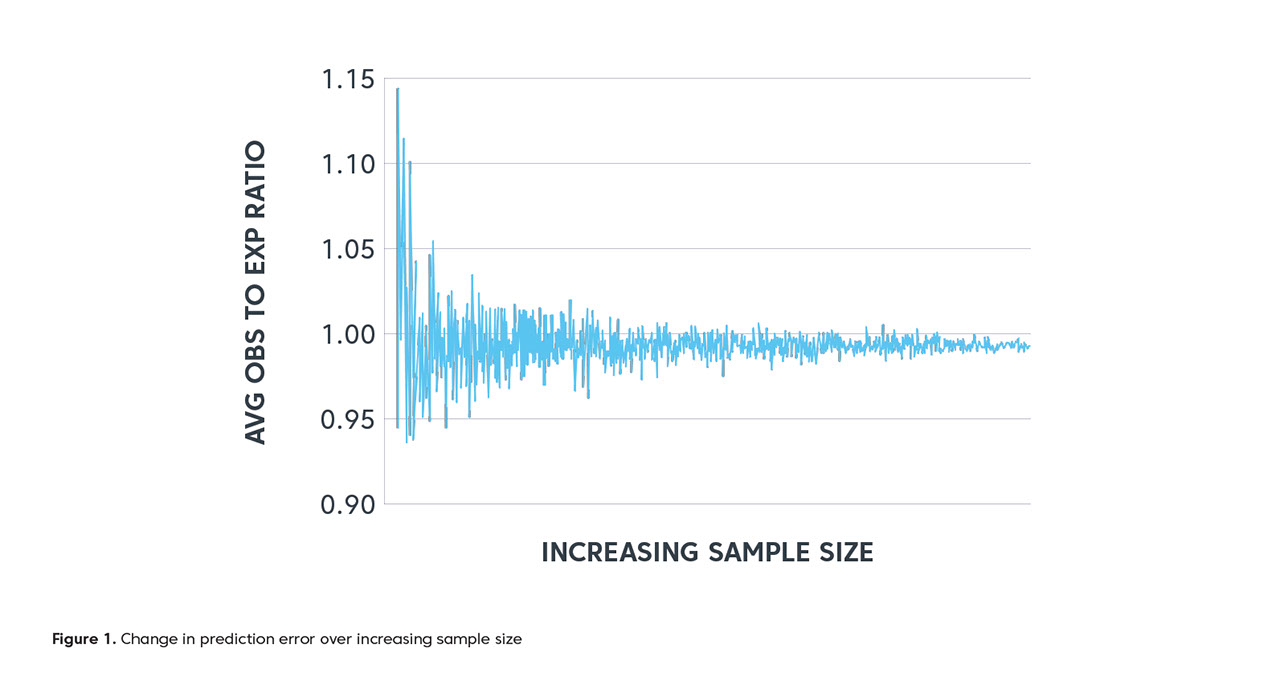
At low sample sizes (points closest to the y-axis) the difference between average actual and average expected costs can be as much as 15%. As sample size increases, however, the gap between these costs becomes smaller and approaches 1.0, the point at which actual and predicted costs are virtually identical.
This means that risk adjustment may not be possible for certain episodes if sample sizes are too small. Unfortunately, there are no specific rules governing appropriate sample sizes to develop reasonable models. Rather, such determinations will depend on the population and episodes being studied by users in the context of their data.
Additional Issues and Considerations
There are several issues for users to consider when applying the risk adjustment models, as they can affect the quality of the analysis and conclusions made from the data. A few of the more important concepts are discussed here.
Relative Provider Prices
Significant variability in pricing between providers and facilities within commercial insurance markets has been extensively documented. While techniques are often used to remove differences in health costs due to pricing variations—usually referred to as price standardization— these methods are not applied within Prometheus Analytics. This has direct implications on risk adjustment, because the expected episode costs predicted by the models will reflect the average price levels within the market. As such, when reporting and comparing risk-adjusted episode costs between providers, the performance of providers with high or low prices relative to the market average will be biased–– even after accounting for differences in case-mix. While Prometheus Analytics views fee-schedule differences as an important source of cost variation to capture and expose, users do have the option to apply a price adjustment factor after the severity adjustment to recalibrate the expected cost for high- or low-priced providers.
Clinical Association of Episodes
One of the key features of Prometheus Analytics is the association of clinically related episodes. For example, costs from the occurrence of a lumbar laminectomy procedure can be attributed back to an individual’s underlying case of osteoarthritis. The benefit is that it provides for a complete accounting of all relevant costs incurred within a chronic condition episode for significant procedures as well as for acute medical events. Nevertheless, the addition of these costs, particularly when substantial, has direct implications on the expected episode costs that are generated by the models.
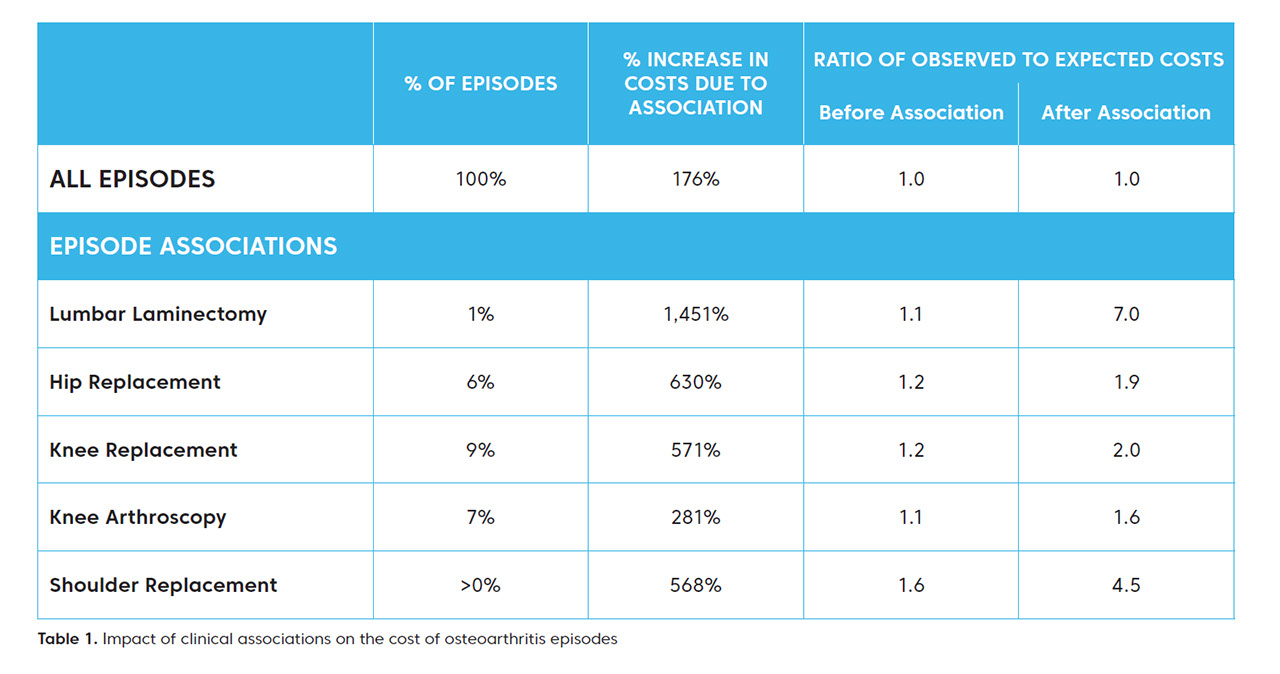
This issue is illustrated in the table below. The table shows the percentage of osteoarthritis episodes in which a major procedure occurred, as well as the average increase in costs for osteoarthritis episodes following association of these procedures. The final two columns give the ratio of actual episode costs to the expected episode costs as predicted by the risk adjustment models.
From this table, the impact of the clinical associations is clear. The association of the procedures to related osteoarthritis episodes substantially raises actual episode costs. And, as a result, the risk adjustment models under-predict costs for these episodes, sometimes substantially. For example, the observed costs of osteoarthritis for individuals who had lumbar laminectomy procedures are just 10% higher on average than those predicted prior to the association. But once the procedure is associated, this gap increases to about 700%.
The point here isn’t that the risk adjustment performs poorly in these cases. Indeed, the inability of linear regression to accurately predict extreme values is well understood. Moreover, to the extent that an episode associated to another was otherwise potentially avoidable or unnecessary, the predictions obtained by the risk adjustment models may better reflect what an individual’s costs would be had they received the most appropriate care. Rather, the idea is for users to fully understand how to properly implement and interpret the risk adjustment models in the context of one of the fundamental concepts of Prometheus Analytics.
Within the Prometheus Analytics risk adjustment, separate models are created for episodes both prior to and after the association of other episodes.
To learn more about µçłµÎŢÂë and our value-based care solutions, contact 1-844-271-1199 or Prometheus_Methodology@changehealthcare.com.